

Why You Should be Interested In the Interest that You Pay and Receive (Part 3)
Stock Market Returns and Savings Interest
In last two post of this series, the detail and math concerning continuously compounded interest was explained in part 1, and debt interest, both compounded and simple were discussed in part 2. Car loans and mortgages are typically calculated using simple interest while credit card debt is compounded daily. Please read Post 1, to get the fundamentals of compounding interest before reading this writing on stock returns and interest. Savers and lenders benefit from continuously compounded interest. This post will focus on the interest and investment returns earned and paid to investors as well as how they are calculated.
Stock Market Returns
Stock returns are calculated annually. The total returns on stocks include capital appreciation as well as dividends paid. They are compounded annually which is called the Compound Annual Growth Rate. The dividends are only included in the CAGR if they are reinvested back into the stock position. Here is an example of how to calculate total return for the S&P 500 Index common stock shares for one year. This example is hypothetical. The buyer of the stock is John Doe (no pun intended).
John Doe bought 100 shares of the S&P 500 at $10 a share on Jan 1= $1,000
S&P 500 Index stock paid dividends of .20 a share during the year
S&P 500 shares are trading at $12 a share on December 31
The annual return is ($1200-$1,000) capital appreciation + (.20 x 100 shares)= $200+$20= $220
The annual % return rate is $220/ $1,000 original investment = 22% annual return
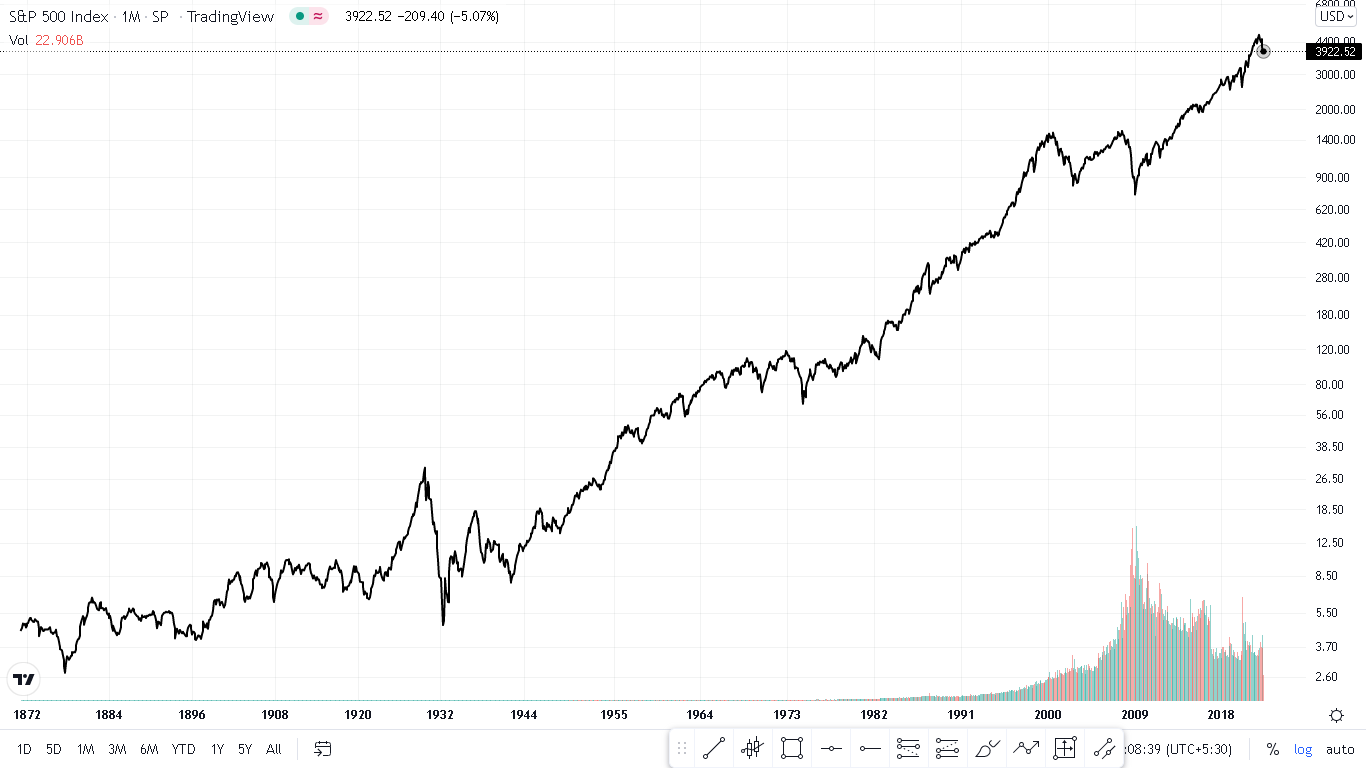
The United States stock market using the S&P 500 Index, which is a group of 500 companies which comprise the largest publicly traded stocks in terms of their market capitalization, has returned a 10 % compounded annual growth rate for the last 100 years. We know how one year of returns are calculated as has been done above, but how is the overall 100 year compounded annual return calculated? The stock market has growth in most years and decay or decline in others, which means that using the simple arithmetic mean to calculate the compounded annual growth rate will not reflect what occurs in the real world. Using the geometric mean calculation will give a result that mirrors the true actual return. What the heck is the geometric return? An example is the best way to illustrate the geometric return and how it models what happens in the real world.
Example: As above, John Doe (JD) has purchased 100 shares of the S&P 500 index stock at $10 a share. Over 5 years the S&P 500 Index stock creates the following one year returns for JD which include dividends that are re-invested. Here are the returns and the balances at the end of each year of the five years.
22% return, $1,000* (1+.22) = $1,220 -value after one year
-13% return, $1,220*(1-.13) = $1,061.40 -value after two years
-9% return, $1,061.40 *(1-.09) = $965.87 -value after three years
25% return, $965.87* (1+.25) = $1,207.34 -value after four years
32% return, $1,207.34* (1+ .32) = $1,593.69 -value after five years
Using the simple arithmetic mean by adding up the returns and dividing by the number of years you get: 57 total returns/ divided by 5 years = 11.4% arithmetic mean. If we use this simple arithmetic mean, we get a different answer then what we calculated by hand above for each year. Therefore, it does not reflect what occurs in the real world.
$1,000(1+ .114 or 11.4%)^5=$1,715.64
This 5-year total of $1,715.64 is much higher than the 5-year total that was calculated by hand for each year. Why!??! Because the arithmetic mean does not consider the annual growth and decline each year. An algebraic equation that includes these annual changes and models’ reality for annual returns is the geometric mean. The equation is:
√(# of years&(1+YR 1 return),x (1+YR 2 return)…….x (1+YR 5 return)) -1
Now let’s plug our 5-year return example’s numbers into the formula and see what happens:
√(5&1.22*.87*.91*1.25*1.32) -1= 9.77%
This is smaller than the arithmetic mean. Let’s now plug the return into our formula to see if it models the real world:
$1,000(1+.9769)^5=$1,593.69
BOOM!!!! The answer models exactly what happens in the real word when we laboriously hand crank each year’s calculations as we did in the example above! The value at the end of 5 years is the same whether we hand crank the calculation for each year or use the formula for the geometric mean. The geometric return calculation should be used anytime there are growth and losses in a financial model over time periods. Math can model what occurs in the real world of time, space, and money. It is always astonishing to see an example like this one.
Compounded Interest on Savings Accounts and CD’s
The interest on most bank savings accounts is compounded continuously: daily, weekly, monthly, or quarterly. These accounts have an interest rate that includes the compounding called Annual Percentage Yield (APY). You will recall that credit card companies quote a rate called Annual Percentage Rate (APR) which doesn’t include the effect of compounding even though credit card companies compound the interest daily on any unpaid balances after the grace period. Let’s take as an example a bank certificate of deposit (CD). A 5-year term may have an interest rate of 2.60% APY for 60 months. The APY already has calculated the effect of compounding. The fine print indicates that the interest is accrued daily but compounded monthly. This is the rate on $5,000 of savings. The calculation of interest over 5 years is:
$5,000(1+(Compounded rate (APY))/(1-Since the rate is already compounded) )^(#of Years)
Let’s plug in the numbers for the CD to determine the interest over 5 years:
$5,000(1+.026/1 )^5=$5,684.69 or rounding up to the next dollar $685 of interest
If the rate quoted was an Annual Percentage Rate that was compounded monthly, the formula would have to include compounding. Most compounded interest savings accounts will quote an Annual Percentage Yield (APY) which will include the compounding. Read the fine print to determine the frequency of the compounding.
Simple Interest on Savings Accounts
Simple interest is interest paid on a principal amount invested. Interest is never paid on interest earned in a simple interest instrument or account. Most US Treasury and Corporate bonds are simple interest instruments. They have a principal amount or par value and a fixed rate amount that is paid out at regular intervals: monthly, quarterly, or bi-annually. The formula for simple interest is straightforward:
Amount=Principal x rate x years
An example is a $1,000 principal amount pays 3% per year for 5 years.
$1,000 x .03 x 5=$150 of interest earned over 5 years
Pay attention to the details of what you earn in your investments. Small amounts earned, compounded annually over time, make a big difference in wealth over a lifetime!!